A/B testing is the practice of showing two variants of the same web page to different segments of visitors at the same time and comparing which variant drives more conversions. In an A/B test, the most important thing is goals that decide a winning test. So, if can we do proper QA/Troubleshoot to check each goal are working that will serve our AB tasting purpose well.
We work hard to make AB test work in properly, but sometimes technology doesn’t work the way you expect it to. For those less-happy moments, VWO provides several ways to troubleshoot your experiment or campaign.
Tools for QA:
Result page: helps you to view result for each goal and the good news is that it updates the result immediately.
Network console: helps you verify whether events in a live experiment are firing correctly.
Browser cookie: helps you verify whether events in a live experiment are firing correctly. It’s stored all the information about all types of goals.
Among all of them, I will say the browser cookie is your best friend. This contains all the information that developers need for troubleshooting experiments, audiences and goals QA.
Browser cookie:
VWO log all records events that occur as you interact with a page on your browser’s cookie. When you trigger an event in VWO it fires a tracking call and stores that information on the browser’s cookie.
To access on browser cookie tab:
Right-click on the page. From the dropdown menu, select Inspect in Chrome or Inspect Element in Firefox.
Select the Application/Storage tab.
Select the Cookies tab.
Select the Domain name of your site.
Filter with “_vis_opt_exp_”.
More specific for a campaign filter with “_vis_opt_exp_{CAMPAIGNID}_goal_”.
You can see the list of all events (all types of goals like click, custom, transection etc) that fired. VWO has a specific number of each goal. I have highlighted the events for few goals on the below screenshot.
VWO stores almost all information (that needed for a developer to troubleshoot) in the browser cookies; like experiments, audiences/segments, goals, users, referrers, session etc. You can find the details about VWO cookies from here.
Network console:
The network panel is a log in your browser that records events that occur as you interact with a page. When you trigger an event in VWO it fires a tracking call, which is picked up in the network traffic.
To access on network tab:
Right-click on the page. From the dropdown menu, select Inspect in Chrome or Inspect Element in Firefox.
Select the Network tab.
Filter with “ping_tpc”.
Click to fire the event you’d like to see the details.
You can see the list of all events that fired. I have highlighted the event that has a specific experiment and goal ID on the below screenshot.
Note: If have already bucketed in an experiment and fired few goals you might not see any network calls. So always go to a fresh incognito browser to troubleshoot goals/experiments.
As VWO immediately update campaign results so it’s always another good option to check result page. But make sure you are the only visitor at that time who is seeing the experiment.
A/B testing is a marketing technique that involves comparing two versions of a web page or application to see which performs better. AB test developing within AB Tasty has few parallels with conventional front-end development. Where the most important thing is goals that decide a winning test. So, if can we do proper QA/Troubleshoot to check each goal are working that will serve our AB tasting purpose well.
We work hard to make AB test work in properly, but sometimes technology doesn’t work the way you expect it to. For those less-happy moments, AB Tasty provides several ways to troubleshoot your experiment or campaign.
Tools for QA:
Preview link: helps you to view variation and move one variation to another, you can also track click goals by enabling “Display Click tracking info’s”.
Network console: helps you verify whether events in a live experiment are firing correctly.
Local storage: helps you verify whether events in a live experiment are firing correctly. It’s stored all the information about all click & custom goals.
Among all of them, I will say the network tab is your best friend. This contains all the information that developers need for troubleshooting experiments, audiences, goals QA and code execution on page load.
Network console:
The network panel is a log in your browser that records events that occur as you interact with a page. When you trigger an event in AB Tasty it fires a tracking call, which is picked up in the network traffic.
To access on network tab:
Right-click on the page. From the dropdown menu, select Inspect in Chrome or Inspect Element in Firefox.
Select the Network tab.
Filter with “datacollectAT” or “ariane.abtasty”.
Click to fire the event you’d like to see the details.
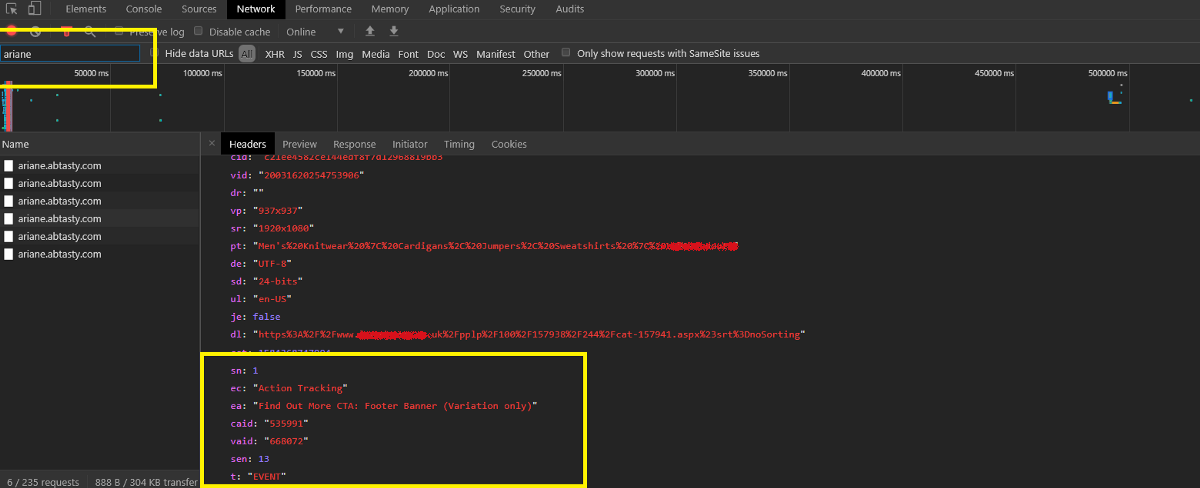
You can see the list of all events(click/custom/transection) that fired. I have highlighted the events name for click/custom goals on the bellow screenshot.
Custom goals are work with the same API call as click goals (so it’s also tracked as an event). That’s why we add a text ‘Custom’ before all custom goals to differentiate between click and custom goals.
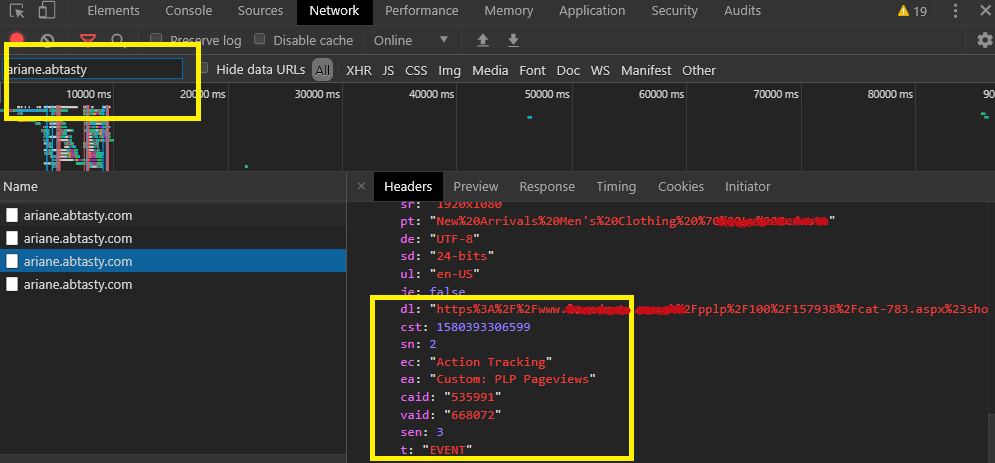
You can see the list of custom events that fired on the bellow screenshot.
Local storage:
AB tasty log all records events that occur as you interact with a page on your browser Local storage. When you trigger an event in AB Tasty it fires a tracking call and stores that information on browser local storage.
To access on Local storage tab:
Right-click on the page. From the dropdown menu, select Inspect in Chrome or Inspect Element in Firefox.
Select the Application/Storage tab.
Select the Local storage tab.
Select the Domain name of your site.
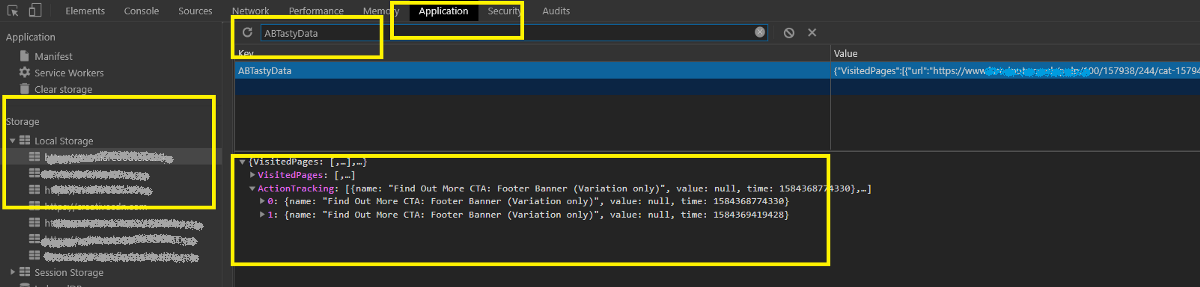
Filter with “ABTastyData”.
Click to ABTastyData you’d like to see the details.
You can see the list of all events(click/custom/transection) that fired. I have highlighted the events name for click/custom goals on the bellow screenshot.
Note: For pageview goal, we have to rely on AB Tasty campaign result page, but the bad news is that it does not update immediately, need to wait 3-4 hours to see the reflections.
We cannot check pageview for AB Tasty by Network console/ Local storage as it’s work differently; It’s tracked the page URL for each of the page and record under each campaign(It has other benefits, like; we can filter the result with any URL without adding it as a pageview goal). AB Tasty manipulates all the goal along with the pageview goals in a certain period and updates that specific campaign results.
A/B testing is a marketing technique that involves comparing two versions of a web page or application to see which performs better. AB test developing within AB Tasty has few parallels with conventional front-end development. Where the most important thing is goals that decide a winning test. So, if can we do proper QA/Troubleshoot to check each goal are working that will serve our AB tasting purpose well.
We work hard to make AB test work in properly, but sometimes technology doesn’t work the way you expect it to. For those less-happy moments, AB Tasty provides several ways to troubleshoot your experiment or campaign.
Tools for QA:
Preview link: helps you to view variation and move one variation to another, you can also track click goals by enabling “Display Click tracking info’s”.
Network console: helps you verify whether events in a live experiment are firing correctly.
Local storage: helps you verify whether events in a live experiment are firing correctly. It’s stored all the information about all click & custom goals.
Among all of them, I will say the network tab is your best friend. This contains all the information that developers need for troubleshooting experiments, audiences, goals QA and code execution on page load.
Network console:
The network panel is a log in your browser that records events that occur as you interact with a page. When you trigger an event in AB Tasty it fires a tracking call, which is picked up in the network traffic.
To access on network tab:
Right-click on the page. From the dropdown menu, select Inspect in Chrome or Inspect Element in Firefox.
Select the Network tab.
Filter with “datacollectAT” or “ariane.abtasty”.
Click to fire the event you’d like to see the details.
You can see the list of all events(click/custom/transection) that fired. I have highlighted the events name for click/custom goals on the bellow screenshot.
Custom goals are work with the same API call as click goals (so it’s also tracked as an event). That’s why we add a text ‘Custom’ before all custom goals to differentiate between click and custom goals.
You can see the list of custom events that fired on the bellow screenshot.
Local storage:
AB tasty log all records events that occur as you interact with a page on your browser Local storage. When you trigger an event in AB Tasty it fires a tracking call and stores that information on browser local storage.
To access on Local storage tab:
Right-click on the page. From the dropdown menu, select Inspect in Chrome or Inspect Element in Firefox.
Select the Application/Storage tab.
Select the Local storage tab.
Select the Domain name of your site.
Filter with “ABTastyData”.
Click to ABTastyData you’d like to see the details.
You can see the list of all events(click/custom/transection) that fired. I have highlighted the events name for click/custom goals on the bellow screenshot.
Note: For pageview goal, we have to rely on AB Tasty campaign result page, but the bad news is that it does not update immediately, need to wait 3-4 hours to see the reflections.
We cannot check pageview for AB Tasty by Network console/ Local storage as it’s work differently; It’s tracked the page URL for each of the page and record under each campaign(It has other benefits, like; we can filter the result with any URL without adding it as a pageview goal). AB Tasty manipulates all the goal along with the pageview goals in a certain period and updates that specific campaign results.
Over the years I kept on preaching about making sure that your traffic is exposed to only one test at any given time. This is to ensure the quality of the test result data, making sure that the winners you are getting from each test are true winners without diluting the data.
This is great when you are gradually getting yourself into the habit of testing. However, when we are talking about implementing a culture of experimentation, constantly running tests to improve customer experience and conversion, this method of testing, unfortunately, fails to achieve that.
As a result, no matter how much you would like to implement a culture of experimentation, you are bound to frustrate your team due to the lack of velocity of running tests. To overcome this, we are introducing a method called Simultaneous Divisional Optimisation (SDO).
What is Simultaneous Divisional Optimisation:
An Experimentation programme that allows you to run multiple tests on any given website by breaking the site down into smaller areas and treating each area as the separate, individual website.
Each area or site section will have its own primary metric to improve via the CRO program. Metrics such as sales or revenue will be tracked to ensure that these don’t have a detrimental impact on the tests running on individual site areas. The winner will be declared based on the performance of the selected primary metric.
How does Simultaneous Divisional Optimisation work:
The best way to understand how SDO works, let’s take a fashion retail business as an example.
If we consider the user journey on any fashion retail site, it typically falls into three core categories:
Browse and find
Research and decide
Transact / Complete purchase
Browse and find
Users who are in this state of the journey are typically looking for the product that they need/want. Pages such as Homepage, Category Landing pages, and Category Listing Pages (or product listing pages) usually support this journey for the users.
Your aim here is to optimise the customer experience by making it easy for the users to find the right product for themselves. Whether to highlight relevant products via the homepage, entice them with the latest collections or give them an easy way to find the category of products they are looking for.
The success or the primary metric potentially at this stage of the user journey is to take the user to one or more product details pages.
Research and decide
Once the user finds a product that they are looking for, they want to find out more about the product. This includes materials, fit, reviews and pricing. The ultimate goal at this stage of the user journey is to add the product to the shopping basket, with a secondary metric of adding it to the wish list.
Optimisation ideas here are potentially to provide the right information to the user in the right manner. Additionally, for the fashion retail website, you might want to help the user by giving them alternatives or “wear it with” to potentially “shop the look”. You can also consider having social messaging such as how many visitors purchased this product, how many visitors have added this product to the basket, and how many visitors are looking at the same product at the same time to show the popularity of the product.
Primary metric is for users to satisfy their needs of finding all the necessary information and add this product to their basket.
Transact / Complete purchase
The final step of the user journey is to complete their purchase. They have done their research, they have added the products they like into their basket, and now this is where they need to go through the process of the transaction. Yes – here the primary metric is indeed the sales. Your optimisation ideas on the basket and checkout funnel are to focus on getting the user to the ‘Thank you’ page. That is the main aim and you need to continuously improve the experience to move users from the basket page to complete the transaction.
Multiple tests in different sections
Now let’s bring all three sections together – in essence, you have now got three site sections that you can optimise independently as the aim of optimising each section is now different from one another. When you are running a test on the Category Listings or Product Listings Pages, your aim to get the user to one or more product details page. Similarly, when running a test on the product details page, your aim is to make the user to add the product to their basket. And finally, when you are improving the checkout funnel, your main aim is for visitors to complete the purchase.
What about other types of websites?
You can use the same theory on pretty much any transactional site. The sections will, of course, be different – for example, if you are working with a travel site, your ‘Browse and find’ section is potentially the search results page of the holiday/flight. The primary metric for optimisation here would be to send the users to a holiday page. Once the users are on an individual holiday page, then the primary aim is to start the booking process.
In a similar manner, you can divide one website into multiple sub-sites with a clear primary objective to be achieved from those sub-sites. This way, you can simultaneously optimise the customer experience for each of the subsections in parallel.
How do you analyse the test results of SDO?
You need to make sure that your primary metric for each site section has been accurately defined. If you find a winner (or loser) based on the primary metric without negatively impacting the final business goals, you can make the decision based on the result.
For any organisation, no matter what the final business goal is, you can always break things down into smaller goals. The SDO simply provides a way to optimise the smaller goals with the aim to ultimately optimise the final business goal.
Taking things further with SDO
What if you would like to launch multiple tests at the same time within the same section? You can still do that with the following two options:
Mutually exclude traffic within that site section
Create variations – one for each hypothesis and a final one with the combination of both hypotheses together
This way, you will be able to make sure that you are getting clear results for your tests running within the same section.
In summary:
SDO provides a way to run multiple experiments at the same time with the aim to continuously improve the customer experience of individual site sections. We have applied this method in a couple of businesses where the traffic amount is over a million per month. This resulted in an increase of test velocity by 10X with a significant revenue impact to the overall business in comparison to running just one test at a time.
SDO allows the organisation to implement an experimentation culture by dividing one website into multiple sites. It engages product owners from different sections to be involved and independently improve their site areas. This method of experimentation utilises the resource more efficiently to get the best out of the CRO program.
In order to make any tools (AB Tasty, Optimizely, VWO, Convert etc) work with your site, you need to insert a snippet (it may have a different name in different tools, like tag, Smartcode etc).
Every tool works hard to ensure that the snippet delivers the best possible experience for visitors to your site, but a few best practices can help ensure optimal site performance. As we are concerned about performance issues or page flickering. We have created this best practice guidance to install the snippet.
Below guidance can improve your testing performance:
Snippet placement:
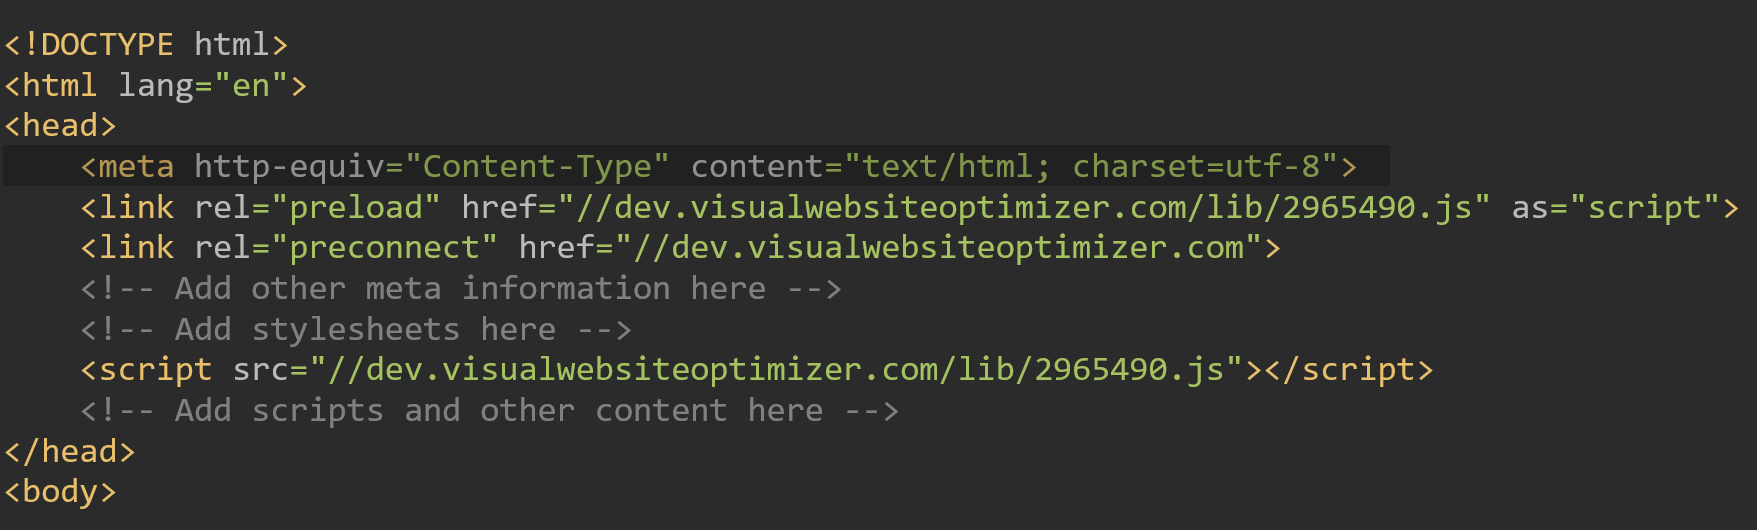
Place the code in the <head> section of your pages so changes are displayed more quickly. Otherwise, a flickering effect may occur: your visitors may see the original page for a fraction of a second before they see the modified page. By calling snippet as high in the source code of your page as possible, our script can apply the changes before the content is displayed.
Place the snippet as the first script tag in the head of the page, but after all charset declarations, meta tags, and CSS inclusions.
Note: If jQuery is already included natively on your site, place the snippet directly after the jQuery.
Snippet load:
You should not install snippet through tag managers such as Google Tag Manager. By default, all the tag managers load snippet code asynchronously, which may cause page flicker on the test pages. Also, using tag managers may lead to delayed loading of the snippet code, which can cause time-out issues and prevent visitors from becoming part of the test.
Include the snippet directly in HTML<head> tag. Don’t deliver the snippet via any tag managers or inject it via client-side scripting.
Snippet type:
The snippet generally comes in two versions: synchronous and asynchronous. Installing the snippet synchronously helps prevent page flickering. Asynchronous loading eliminates any delay in page load times but greatly increases the chances of flashing. You can learn more about synchronous and asynchronous snippet loading, including the strengths and drawbacks of both load types.
In most cases, most of the tools recommend using the synchronous snippet. If the snippet is placed in your site’s <head> tag, you’ll be sure that your modifications will be applied immediately, before the site loads. This will avoid the flickering effect, and offer the best user experience.
Use the synchronous snippet
Note: Few tools recommend using the asynchronous snippet, like VWO. Before using synchronous or asynchronous snippet please have a look on advantage and disadvantage from that specific tool’s documentation.
Use preconnect and preload:
Add preconnect and preload tags at the top of the head for faster synchronous loading. We recommend using preconnect to open a connection to the server of specific tools to event endpoint, ahead of time.
Use preconnect and preload tags
In the example below, replace “http://dev.visualwebsiteoptimizer.com/lib/2965490.js” with your snippet and “//dev.visualwebsiteoptimizer.com” with the server of your tool.
You can find the server address from to preconnect from asking the customer support of specific tools. Bellow adding few server addresses for specific tools that might help you.
Optimizely: //logx.optimizely.com
VWO: //dev.visualwebsiteoptimizer.com
AB Tasty: //ariane.abtasty.com/
Convert: //logs.convertexperiments.com
Minimize the number of pages and events:
In a few tools, all pages and events are included in the basic snippet that increases the size of the snippet. To keep the overall snippet size small, avoid creating pages where you don’t expect to run experiments, and archive any unused pages, events and experiments.
Minimize the number of pages, events and experiments.
Use analytics:
Use an analytics tool to identify traffic that represents your visitors so you can optimize your site for the majority of people who visit. For example, if you find that most of your traffic is from mobile devices, you can target your experiments for mobile users.
Use analytics to target your testing
Best practice documentation:
Every tool has its own documentation to implement the snippet where they mention the best practices guideline for improving site performance or strengths and drawbacks of various implementation type. Don’t forget to have a look at that because they might have a few more recommendation. Read the documentation carefully and implement it in a way that fulfils your requirements.
Read tools specific documentation.
Summary:
Place the snippet as the first script tag in the head of the page, but after all charset declarations, meta tags, and CSS inclusions.
Include the snippet directly in HTML<head> tag. Don’t deliver the snippet via any tag managers or inject it via client-side scripting.
Use the synchronous snippet
Use preconnect and preload tags
Minimize the number of pages, events and experiments.
In order to make any tools (AB Tasty, Optimizely, VWO, Convert etc) work with your site, you need to insert a snippet (it may have a different name in different tools, like tag, Smartcode etc).
Every tool works hard to ensure that the snippet delivers the best possible experience for visitors to your site, but a few best practices can help ensure optimal site performance. As we are concerned about performance issues or page flickering. We have created this best practice guidance to install the snippet.
Below guidance can improve your testing performance:
Snippet placement:
Place the code in the <head> section of your pages so changes are displayed more quickly. Otherwise, a flickering effect may occur: your visitors may see the original page for a fraction of a second before they see the modified page. By calling snippet as high in the source code of your page as possible, our script can apply the changes before the content is displayed.
Place the snippet as the first script tag in the head of the page, but after all charset declarations, meta tags, and CSS inclusions.
Note: If jQuery is already included natively on your site, place the snippet directly after the jQuery.
Snippet load:
You should not install snippet through tag managers such as Google Tag Manager. By default, all the tag managers load snippet code asynchronously, which may cause page flicker on the test pages. Also, using tag managers may lead to delayed loading of the snippet code, which can cause time-out issues and prevent visitors from becoming part of the test.
Include the snippet directly in HTML<head> tag. Don’t deliver the snippet via any tag managers or inject it via client-side scripting.
Snippet type:
The snippet generally comes in two versions: synchronous and asynchronous. Installing the snippet synchronously helps prevent page flickering. Asynchronous loading eliminates any delay in page load times but greatly increases the chances of flashing. You can learn more about synchronous and asynchronous snippet loading, including the strengths and drawbacks of both load types.
In most cases, most of the tools recommend using the synchronous snippet. If the snippet is placed in your site’s <head> tag, you’ll be sure that your modifications will be applied immediately, before the site loads. This will avoid the flickering effect, and offer the best user experience.
Use the synchronous snippet
Note: Few tools recommend using the asynchronous snippet, like VWO. Before using synchronous or asynchronous snippet please have a look on advantage and disadvantage from that specific tool’s documentation.
Use preconnect and preload:
Add preconnect and preload tags at the top of the head for faster synchronous loading. We recommend using preconnect to open a connection to the server of specific tools to event endpoint, ahead of time.
Use preconnect and preload tags
In the example below, replace “http://dev.visualwebsiteoptimizer.com/lib/2965490.js” with your snippet and “//dev.visualwebsiteoptimizer.com” with the server of your tool.
You can find the server address from to preconnect from asking the customer support of specific tools. Bellow adding few server addresses for specific tools that might help you.
Optimizely: //logx.optimizely.com
VWO: //dev.visualwebsiteoptimizer.com
AB Tasty: //ariane.abtasty.com/
Convert: //logs.convertexperiments.com
Minimize the number of pages and events:
In a few tools, all pages and events are included in the basic snippet that increases the size of the snippet. To keep the overall snippet size small, avoid creating pages where you don’t expect to run experiments, and archive any unused pages, events and experiments.
Minimize the number of pages, events and experiments.
Use analytics:
Use an analytics tool to identify traffic that represents your visitors so you can optimize your site for the majority of people who visit. For example, if you find that most of your traffic is from mobile devices, you can target your experiments for mobile users.
Use analytics to target your testing
Best practice documentation:
Every tool has its own documentation to implement the snippet where they mention the best practices guideline for improving site performance or strengths and drawbacks of various implementation type. Don’t forget to have a look at that because they might have a few more recommendation. Read the documentation carefully and implement it in a way that fulfils your requirements.
Read tools specific documentation.
Summary:
Place the snippet as the first script tag in the head of the page, but after all charset declarations, meta tags, and CSS inclusions.
Include the snippet directly in HTML<head> tag. Don’t deliver the snippet via any tag managers or inject it via client-side scripting.
Use the synchronous snippet
Use preconnect and preload tags
Minimize the number of pages, events and experiments.
Use analytics to target your testing
Read tools specific documentation.
AB test development within Optimizely is delightful and seamless. Front end testing development has few similarities with the conventional front-end development work. However, the most important thing is the goals or metrics that decide the result of the test. We need to do proper QA/Troubleshoot to check each goal; that they are working as expected as otherwise, the whole development of the testing work would be meaningless.
We work hard to make a test work in properly, but sometimes technology doesn’t work the way you expect it to. In this article, I have provided a list of five options that Optimizely provides to troubleshoot your experiment or campaign.
Tools for QA:
Preview tool: helps you check the experiments and campaigns functionality visual changes for different audiences and events fire details.
JavaScript API: helps you verify what live experiments and campaigns are running on a page and which variation you’re bucketed into.
Network console: helps you verify whether events in a live experiment or campaign are firing correctly.
Optimizely’s cookies and localStorage: helps you to uniquely identify visitors, track their actions, and deliver consistent experiences across page loads.
Optimizely log: helps you diagnose more difficult issues in a live experiment or campaign. It tells you about the activated experiment or campaign on the page, qualified audience, applied changes on a page and even events that are fired on each action.
Among all of them, I will say the Optimizely log is your best friend. This log contains all the information that developers need for troubleshooting experiments, segments, audiences, goals and code execution on page load.
I would like to discuss this Optimizely log with a few examples. If your requirements do not serve with this, you can go with other options available in the above links.
Optimizely log:
The Optimizely log allows you to “read Optimizely’s mind” by printing the execution of targeting and activation decisions, variation changes, events, and third-party integrations on a page in your browser’s console.
Use the Optimizely log to investigate all kind of issues, even those issues that you can’t easily diagnose. For goals QA, it is the best weapon in Optimizely.
The log can help you to check:
Is an experiment or campaign loading correctly?
Is the user qualified for an audience condition?
Are the changes you made, applied on the page?
Is the page activated on the URL(or specific condition)?
Is a click/custom goal fired?
You can check all of this with the Optimizely log. But here; I will show the example for page activation (Pageview goals) and click/custom goal.
You can access the log in two ways:
With a query parameter: Add this query parameter to the URL and reload, boom!!
optimizely_log=info
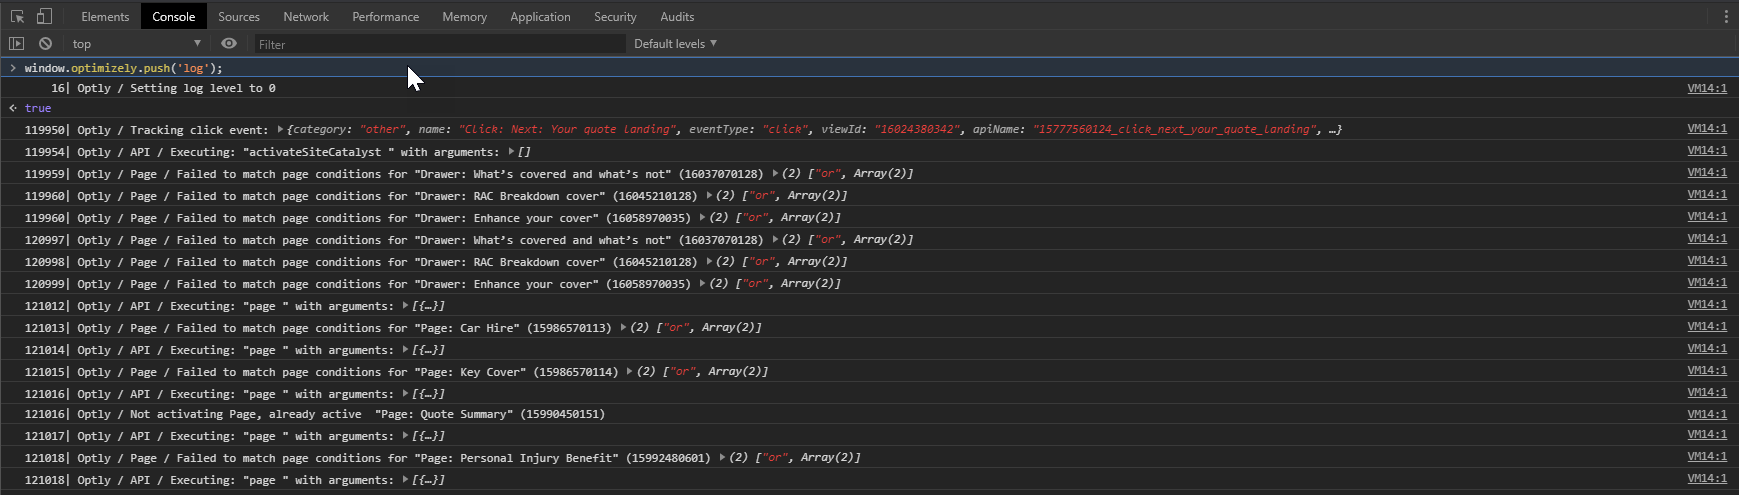
With the JavaScript API: Paste it to browser console and hit enter.
window.optimizely.push('log');
This will then return something like:
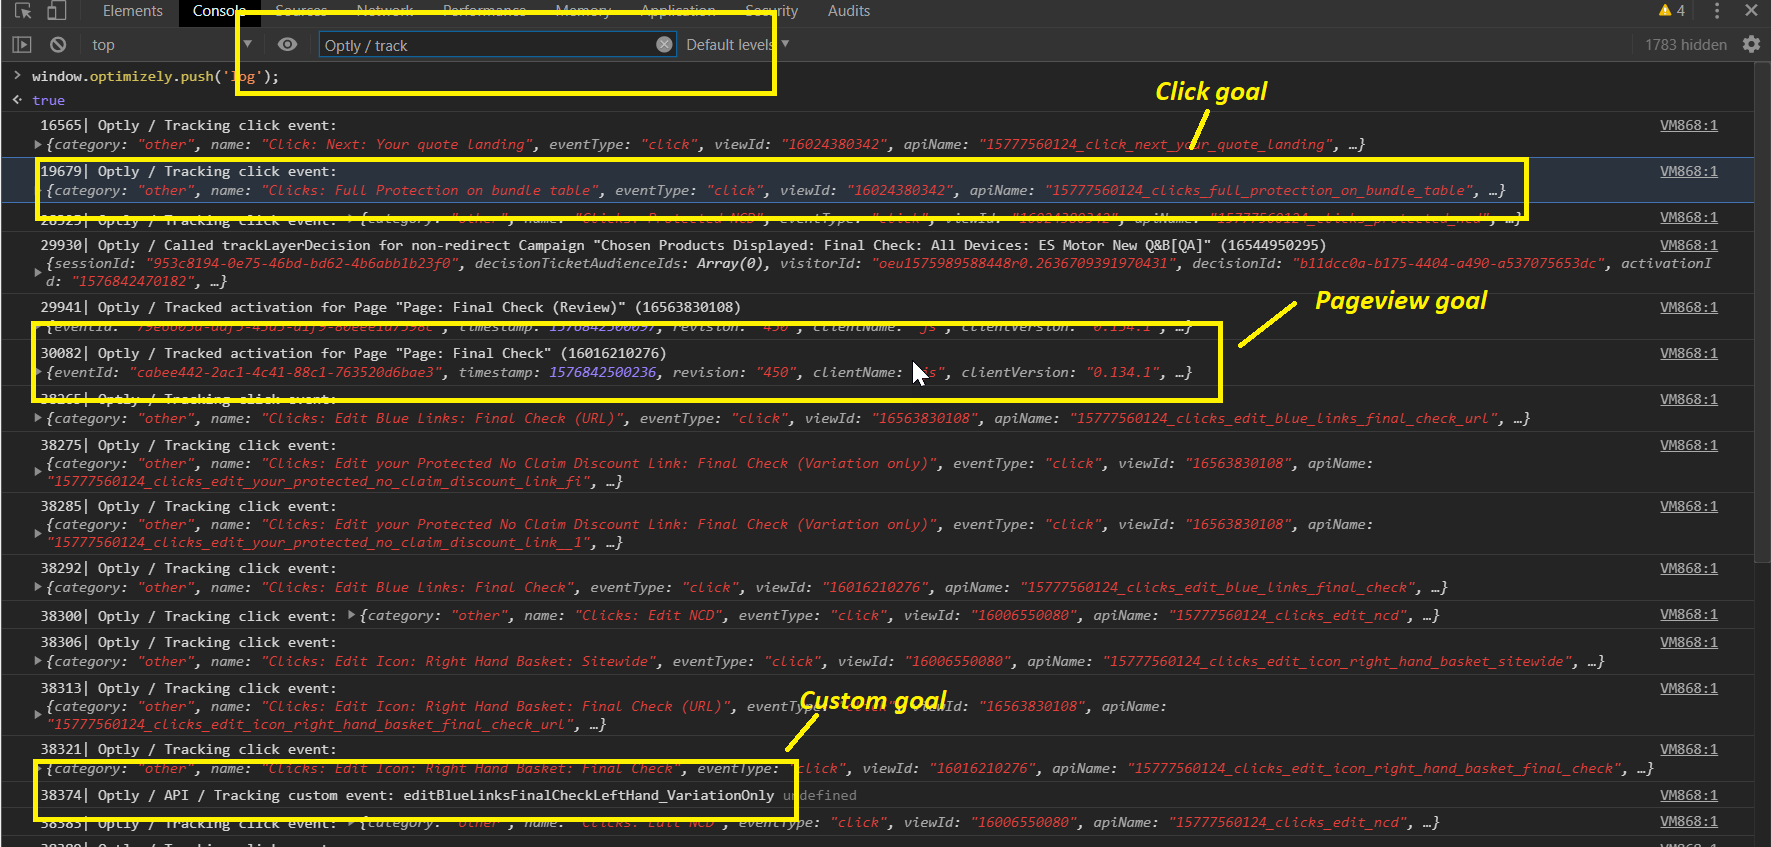
For pageview / click/ custom goal filter the console with “Optly / Track”. I have highlighted on the bellow screenshot for click/pageview/custom goals simultaneously.
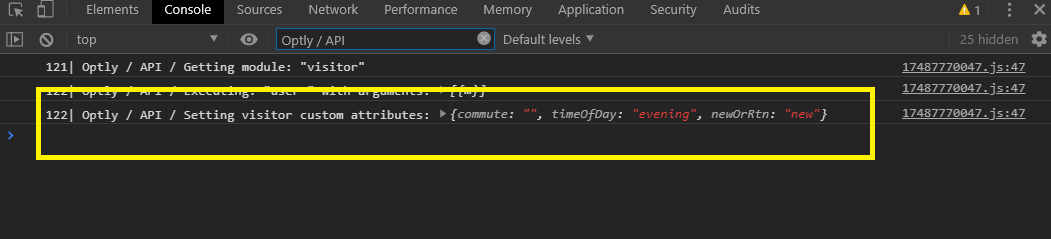
For custom segments/attributes filter the console with “Optly / API”. I have highlighted on the below screenshot for custom segments.
Remember; custom segments could only fire once for a session. So, you might need to check in a new private window each time; to see the custom segments are working.
Reference: If you specifically troubleshoot for the audience, page, campaign, traffic allocation & bucketing, variation code and click/custom goals visit here.
AB test development within Optimizely is delightful and seamless. Front end testing development has few similarities with the conventional front-end development work. However, the most important thing is the goals or metrics that decide the result of the test. We need to do proper QA/Troubleshoot to check each goal; that they are working as expected as otherwise, the whole development of the testing work would be meaningless.
We work hard to make a test work in properly, but sometimes technology doesn’t work the way you expect it to. In this article, I have provided a list of five options that Optimizely provides to troubleshoot your experiment or campaign.
Tools for QA:
Preview tool: helps you check the experiments and campaigns functionality visual changes for different audiences and events fire details.
JavaScript API: helps you verify what live experiments and campaigns are running on a page and which variation you’re bucketed into.
Network console: helps you verify whether events in a live experiment or campaign are firing correctly.
Optimizely’s cookies and localStorage: helps you to uniquely identify visitors, track their actions, and deliver consistent experiences across page loads.
Optimizely log: helps you diagnose more difficult issues in a live experiment or campaign. It tells you about the activated experiment or campaign on the page, qualified audience, applied changes on a page and even events that are fired on each action.
Among all of them, I will say the Optimizely log is your best friend. This log contains all the information that developers need for troubleshooting experiments, segments, audiences, goals and code execution on page load.
I would like to discuss this Optimizely log with a few examples. If your requirements do not serve with this, you can go with other options available in the above links.
Optimizely log:
The Optimizely log allows you to “read Optimizely’s mind” by printing the execution of targeting and activation decisions, variation changes, events, and third-party integrations on a page in your browser’s console.
Use the Optimizely log to investigate all kind of issues, even those issues that you can’t easily diagnose. For goals QA, it is the best weapon in Optimizely.
The log can help you to check:
Is an experiment or campaign loading correctly?
Is the user qualified for an audience condition?
Are the changes you made, applied on the page?
Is the page activated on the URL(or specific condition)?
Is a click/custom goal fired?
You can check all of this with the Optimizely log. But here; I will show the example for page activation (Pageview goals) and click/custom goal.
You can access the log in two ways:
With a query parameter: Add this query parameter to the URL and reload, boom!!
optimizely_log=info
With the JavaScript API: Paste it to browser console and hit enter.
window.optimizely.push('log');
This will then return something like:
For pageview / click/ custom goal filter the console with “Optly / Track”. I have highlighted on the bellow screenshot for click/pageview/custom goals simultaneously.
For custom segments/attributes filter the console with “Optly / API”. I have highlighted on the below screenshot for custom segments.
Remember; custom segments could only fire once for a session. So, you might need to check in a new private window each time; to see the custom segments are working.
Reference: If you specifically troubleshoot for the audience, page, campaign, traffic allocation & bucketing, variation code and click/custom goals visit here.
A friend of mine has recently asked if I can help him with creating an Excel file to calculate the power of A/B test results. I found one calculator online here which I think is pretty sleek but the only problem is, it is online. So if you want to do your own calculation using your excel file, you will need to know the maths behind it.
Rather than getting into the details of what the statistical power is, in simple terms, the statistical power determines the possibility of Type II error (or false negative) within the result that you are seeing from the test.
I have created this Excel file which follows the same calculation that has been used by the AB Test Guide (https://abtestguide.com/calc/) to calculate the statistical power of any A/B test.
Instruction to use this excel file to calculate statistical power is pretty self explanatory:
Select whether the test is 1-Tail or 2-Tail (in most cases, if you are running A/B tests using major tools that are in the market – it should be 2-Tail)
Select the confidence level (90% / 95% / 99%)
Add the visitor numbers for your control and variation
Add the conversion numbers (NOT Conversion Rate) for your control and variation
That’s it! It will show the power of the test – in other words – the possibility of Type II errors (the lack of it).
“Our whole website has been redeveloped and now it is using a new SPA framework. My development team is saying that we can’t build tests using Adobe Target on the new site because the way the pages are changing, it is not loading the test scripts.” – Sounds familiar? Well, you are not alone. I am going to talk through a way to tackle this issue that will make sure that you don’t need to worry about running tests using Adobe Target on SPA sites.
Why is this a challenge:
In short, the main purpose of using an SPA is to speedup page loads. The common elements within the page (such as header, footer, layouts etc) usually stays the same but inner content changes when a user navigates from one page to another. In most cases, using an SPA helps speed up the page load by only fetching the core content that needs to be updated on the page rather than the elements that are already delivered to the user.
This poses an issue with widely used A/B testing tools such as Adobe Target, Optimizely, Monetate, VWO, Convert, Optimize etc. Why – because the “single line of JavaScript tag” that has been implemented across the site no longer gets reloaded when the page content is changing. As a result, if let’s say you are targeting your funnel step 2 to run an experiment, your testing tool will not be able to detect when the user has landed on that step and display the variation. Bummer…
What can you do within Adobe Target (1.x) to detect the changes and run a test
You need to run two experiments:
1. A background experiment running globally to 100% traffic without any changes apart from some JavaScript code,
2. Your core experiment that will have the variation code for your experiment
Within the background experiment, by using MutationObserver you can detect the changes to the page content. When you detect any changes, find the element that signifies the specific page – e.g. Step 1: Delivery Address / Step 2: Billing Address etc. You will then need to make a call to getOffer() and applyOffer().
Now let’s get to your original experiment – for this use a Form based experiment and target the mbox called newPage. Although this is not necessary, it is a good idea to specify the additional targeting conditions here – such as custom parameter loadedPage is PageX.
Add your JS code here to make your variations, including your goals and additional targeting conditions. And that’s it! The background experiment will continuously listen to the page changes and whenever it finds the right page to run your experiment, it will call for that form based experiment, put the visitor in control or one of the variations, and the experiment will work as normal.
So, you’ve got a strong hypothesis, the design has been approved and the development of the test variations are looking great. But then you launch the test, and after a couple of weeks, you notice that your metrics aren’t showing the right amount of visitors. It’s confusing, right? You might even start challenging your research-backed hypothesis, only to later find out that the metrics weren’t correctly implemented.
Now, you’ve lost two weeks’ worth of testing that you’ll never get back. Not ideal, obviously. Well, this is a major mistake that can be easily avoided, using just four simple steps.
Step1: Set aside time for metrics setup
When you’re estimating how long it’ll take to build the test, make sure that you set aside specific time for implementing the right metrics.
Step 2: Assess and define the metrics you want to track
Ensure that you’ve got the right metrics as part of your test plan or brief that you want to track. Define them clearly;, regardless of whether it’s a simple click goal, a pageview goal or a goal that’ll only be tracked in certain conditions (for example, ‘only click ATB buttons when the user selects a quantity’).
Step 3: Check whether the metrics are firing correctly
When you’re QAing your tests, make sure you interact with the pages to see if the metrics are firing as they should. There’re a few ways of doing this. Some A/B testing tools provide a preview option that also shows the metrics that’re being tracked. You can also check that the right metrics are being fired within the console/network tab of your browser. Ideally, using a separate solutions engineer to make this check to find issues with any setup will be the best way to ensure there’s no problems.
Step 4: Check if the data is coming through on the reports
Finally, launch the experiment internally (via QA Cookie or by targeting specific IP addresses) and interact with page elements that should fire the metrics. Check within your report to see if those metrics are correctly showing on the results page as expected. To us, this is the most important step to ensure that all your metrics are working and tracking properly for your tests.
You might be thinking that all this will add time to your overall testing process, but when you think about the consequences of failing to setup the right metrics, the extra time to get things right is much better than how much testing time you’d lose if you don’t!
When you get a test plan, don’t just jump straight into developing. If you think that this will save your time, think again. If your test development process is not adequately thought; it is more likely that you are not developing most efficiently and struggling to meet your deadlines. After thousands hours of test development analysis and speaking with our experienced developers, QA Engineers, we came up with a robust process of AB test development. It will help you to save your development time, increase efficiency and quality of the work, and will help you deliver the testing variation code on time.
Here are the steps:
Analysis of the website
Development approach
Initialise markup
Digging deeper
Implement functionality
Pre-QA
1. Analysis of the website:
Website Analysis is the most crucial phase of the process that can save a lot of time. So read the test plan carefully, go to the website for which you are going to build the test. Check whether this site has jQuery or not, which javascript library/plugin they are using, is this an SPA, which tool they are using (Optimizely, VWO, Adobe Target, AB Tasty etc), does the site have any dataLayer , are they using any CSS framework (like Bootstrap, Foundation, Bluma etc), check the checkout funnel of the website if necessary. What to check, is dependent on the test requirement, and you can decide about it after reading the test plan.
For example, if there is jQuery on the site, and, we know that jQuery is the best library for that. So we don’t need to waste the time by writing long plain JavaScript to change the text of all headings. (you can do it with one line of jQuery code, right?)
If the website is a SPA, be careful about the CSS selectors. You can use history.pushState to detect the change of the state(URLs, DOM, event etc) and based on that you might need to do the modification on your variation. You can also use MutationObserver to detect the DOM changes; cool javascript feature, I know!
The test is in Optimizely!! Why do you need to create some custom polling function? Optimizely has the utility library – utils, take the full facility of it. Want some sample code? here you go. Do you love to work with CLI? Optimizely has a REST API, instead of creating and maintaining projects using the Optimizely web dashboard you can create an experiment programmatically. Those tools have their own API, utility library don’t forget to take the benefit of it.
The website has Bootstrap!! Why are you wasting time to create a button colourfull? – just add a class.
2. Development approach:
This phase is the foundation where you are planning how you are going to write your code. It involves requirements gathering -like assets needed, any APIs or library that you are going to use, how you are going to do the markup, how to implement the functionality, how you are going to use the functionality of the control etc. Invest some time on it will keep you safe from uncertain situations that will force you to change the development approach in the middle of the development.
3. Initialize markup:
In this phase, you are going to create the DOM layout and design all the visual content; where your variation takes shape. So, you are going to do all the HTML and CSS stuff here. The control DOM structure & the functionality you are changing in the variation must be kept in mind whilst you are doing the markup. Check all primary function of the layout that needs to present in the variation; such as correct text, colours, images, accurate and responsive design etc.
If you are following a code structure to develop the variations, that is great. If not, spend some time to come up with a structure to have a common template that you can reuse in the future.
4. Digging deeper:
You just coded the markup. Are you sure it will work for all devices, it will fulfil your all requirements that are mentioned in the test plan? Did you miss anything? What if you have a different design for mobile that is not achievable with your markup? You might need to have some unique selectors for a variation only for goals/metrics setup. You just created a list of a banner that might need to be part of a slider/carousel on mobile devices. Is this markup compatible with the new functionality described in the test plan? So dig deeper, consider all the scenario that needs to be in your code and improve your markup if needed.
5. Implement functionality:
If you need to do something on the scroll, need to change slider/carousel images automatically, need to open a popup when a user clicks on a link; this is the correct time to implement all JavaScript functionality that you need to make your variation interactive.
6. Pre-QA:
Wait! You are not done yet. I’m sure you don’t want to back and forth by doing the bug fixing. You have done the hard part, you have given a lot of effort. Did you check at least one browser per device? What if your code does not work well after putting them in the tools? Is there a flickering issue or a loading issue? What if the code is not working correctly on Edge? Bugs are annoying, it makes you lose your head sometimes. So before sending the variation to the client/QA team do a quick QA on your own. If you find any issues, deal with it – update the code accordingly.
We have a separate article regarding the bug fixing, check it out. Bugs can be solved efficiently with a proper process.
Considerations:
When you developing an AB test you consider the following things:
Functionality of control
CSS: Use CSS from the control as much you can
Javascript: Use Javascript from the control as much you can
Prefer CSS solution: If you can do something with CSS don’t do it with javascript
Don’t create anything if it is not needed
Loading approach: Don’t forget to consider the dependency of loading the variation
Over the years, I have heard many people saying that their consultants, and in some cases, the developer who is building the test is also doing the QA of the variations. This is potentially hazardous and prone to missing out on finding bugs before the test is live. As a result, the research and data-backed hypothesis test or A/B test could bring back incorrect results. In this article, I have summarized six key reasons as to why you should be doing independent manual QA of all of your variations.
1. Developers and consultants are too close to the test:
Your developer and potentially your consultant are too close to the test that they are building – making it very easy to miss out small but important details if they are in charge of QA
2. Emulators are not the real thing:
“Vege hotdog tastes the same as the real hotdog” Sorry but they are not the same. Your end-users will not use an emulator – they will use the real device and browser. If you are not manually checking them on actual device/browsers, there is a potential that you will miss out on finding issues specific to real browsers
3. Interactions:
If you are not manually checking the variations, you might miss out on issues related to interactions to the page/variations. This could be opening an accordion, clicking on a button or going through the funnel itself.
4. Checking goal firing:
If you are not doing a QA across all browsers manually, you might not be able to test out whether your metrics setup are correct. In a worst-case scenario, you might look at your result after a couple of weeks and notice that your primary metric did not fire properly for some browsers or at all!
5. Breakpoints and changing device display mode:
If you are using emulators, you might miss out any issues related to switching the mode from Portrait to Landscape or vice versa. By QAing the variations on actual mobile/tablet devices, you can easily spot check if the variation is displaying correctly on both modes, but also when the user is switching between the two, the behaviour is as it should.
6. Tests from a Human Perspective:
Manual QA helps to quickly identify when something looks “off.” Automated test scripts don’t pick up these visual issues. When a QA Engineer interacts with a website or software as a user would, they’re able to discover usability issues and user interface glitches. Automated test scripts can’t test for these things.
This is why, here at EchoLogyx, our dedicated QA Engineers always use actual devices and test all variations on the targeted browsers to find issues. They have to be thorough to make sure that no bugs are present in any variations or any development work before we deliver the work. They need to check all possible scenarios and their target is to break the work that our engineers are doing. Essentially our QA team are the gatekeepers to approve whether the test is ready to go live or not. This significantly reduces the risk of getting a bad user experience to the end-users who will be using the site.